OpenTelemetry tracing for Java AWS Lambda

Introduction
In modern cloud-native applications, observability is crucial for understanding your services' health, performance, and usage patterns. Distributed tracing is one of the most important observability techniques, as it allows you to visualize and monitor the flow of requests across microservices, functions, and other components in your architecture.
For AWS Lambda applications, which are stateless and ephemeral, distributed tracing becomes particularly useful to track the lifecycle of requests and troubleshoot performance issues. OpenTelemetry, an open-source, vendor-agnostic framework, offers a powerful solution for capturing and sending trace data.
In this post, we will explore how to set up OpenTelemetry tracing in Java-based AWS Lambda functions, compare different approaches, measure performance, and write the most optimal solution.
Why Use OpenTelemetry Tracing for AWS Lambda?
AWS Lambda provides a highly scalable, event-driven platform for running stateless functions. However, Lambda functions' stateless and ephemeral nature presents challenges for observability.
By using OpenTelemetry for tracing, you can:
- Track end-to-end request flows: Monitor the complete lifecycle of an invocation, even if it spans multiple Lambda functions or services.
- Debug cold starts: Capture the latency of Lambda cold starts and optimize resource allocation.
- Correlate traces across services: Get a unified view of interactions between Lambda functions, other AWS services (e.g., DynamoDB, SQS), and external services.
- Identify performance bottlenecks: Visualize latency and bottlenecks in the application lifecycle
Prerequisites
To do this research I installed OpenTelemetry collector on my EC2 in the public subnet and exposed gRPC and HTTP protocols:
receivers:
  otlp:
    protocols:
      grpc:
        endpoint: "0.0.0.0:4317"  # Standard OTLP gRPC port
      http:
        endpoint: "0.0.0.0:4318"  # Standard OTLP HTTP port
So our Lambda will send traces to OpenTelemetry collector and collector then will push it to some backend (in my case I prefer Datadog)
All source code you can see in my GitHub
Approach 1: OpenTelemetry Lambda layer
OpenTelemetry already has Lambda layers for almost all runtimes. Let’s try it !
OpenTelemetry Lambda Instrumentation and OpenTelemetry SDK are bundled into the java/lib directory to be available on the classpath of the Lambda function. No code change is needed to instrument the execution of your function, but you will need to set the AWS_LAMBDA_EXEC_WRAPPER environment variable pointing to the appropriate wrapper for the type of handler.
I’m using Terraform and to add this layer we just need to add 2 environment variables and 1 layer:
resource "aws_lambda_function" "example_lambda_with_layer" {
  function_name    = var.function-name
  source_code_hash = base64sha256(filebase64(local.lambda_payload_filename))
  runtime          = "java21"
  handler          = "com.filichkin.lambda.SampleHandler::handleRequest"
  filename         = local.lambda_payload_filename
  role             = aws_iam_role.lambda_role.arn
  memory_size      = 256
  timeout          = 20
  environment {
    variables = {
      AWS_LAMBDA_EXEC_WRAPPER = "/opt/otel-handler"
      OTEL_EXPORTER_OTLP_ENDPOINT= "http://my-ec2-public-ip:4317"
    }

  }
  layers = [
  "arn:aws:lambda:eu-west-1:901920570463:layer:aws-otel-java-wrapper-amd64-ver-1-32-0:3"
  ]
}
Let's deploy HelloWorld lambda and check the result
public class SampleHandler implements RequestHandler<APIGatewayProxyRequestEvent, APIGatewayProxyResponseEvent> {
    @Override
    public APIGatewayProxyResponseEvent handleRequest(APIGatewayProxyRequestEvent apiGatewayProxyRequestEvent, Context context) {

        System.out.println("lambda is invoked");

            APIGatewayProxyResponseEvent apiGatewayProxyResponseEvent = new APIGatewayProxyResponseEvent();
            apiGatewayProxyResponseEvent.setBody("hello-world");
            return apiGatewayProxyResponseEvent;
    }
}
Result
The traces were sent with 0 code changes.

But
Cold start: 8 seconds for 256 MB Lambda !!!
Warm start: 65 ms on average for 256 MB Lambda


Is the problem in the OpenTelemetry layer?
Yes, because without layer we have a 600ms cold start

Approach 2: Lambda + OpenTelemetry Java SDK
To get started with OpenTelemetry tracing in Java AWS Lambda, you need to add the necessary dependencies.
1. Adding Dependencies
I highly recommend using bom for opentelemetry dependencies . Especially when you instrument different libraries:
<dependencyManagement>
        <dependencies>
            <dependency>
                <groupId>io.opentelemetry.instrumentation</groupId>
                <artifactId>opentelemetry-instrumentation-bom</artifactId>
                <version>2.10.0</version>
                <type>pom</type>
                <scope>import</scope>
            </dependency>
        </dependencies>
 </dependencyManagement>
Then we need to add two dependencies
        <dependency>
            <groupId>io.opentelemetry</groupId>
            <artifactId>opentelemetry-sdk</artifactId>
        </dependency>
        <dependency>
            <groupId>io.opentelemetry</groupId>
            <artifactId>opentelemetry-exporter-otlp</artifactId>
        </dependency>
2. Initializing OpenTelemetry SDK
You’ll need to set up the OpenTelemetry SDK to capture traces and send them to your desired backend. Below is an example of how to initialize the OpenTelemetry SDK in an AWS Lambda function.
public class SampleHandler implements RequestHandler<APIGatewayProxyRequestEvent, APIGatewayProxyResponseEvent> {

    private static final String OTEL_ENDPOINT = "http://your-otel-host:4317";
    static {
        // Set up OpenTelemetry SDK
        BatchSpanProcessor spanProcessor = BatchSpanProcessor.builder(OtlpGrpcSpanExporter.builder().setEndpoint(OTEL_ENDPOINT).build()).build();
        SdkTracerProvider tracerProvider = SdkTracerProvider.builder().addSpanProcessor(spanProcessor).build();
        OpenTelemetrySdk.builder().setTracerProvider(tracerProvider).buildAndRegisterGlobal();
    }
    private static final Tracer tracer = GlobalOpenTelemetry.getTracer("LambdaTracer");

    public APIGatewayProxyResponseEvent handleRequest(APIGatewayProxyRequestEvent apiGatewayProxyRequestEvent, com.amazonaws.services.lambda.runtime.Context context) {
        // Start a span to trace the Lambda invocation
        Span span = tracer.spanBuilder("LambdaInvocation").startSpan();
        try {
            APIGatewayProxyResponseEvent apiGatewayProxyResponseEvent = new APIGatewayProxyResponseEvent();
            apiGatewayProxyResponseEvent.setBody("hello world");
            return apiGatewayProxyResponseEvent;
        } finally {
            span.end();  // End the span
        }
    }
}Lamda works fine however I don’t see any tracing.
Why Lambda doesn't send traces ?
Lambda freezes the container if there are no new requests coming. When it occurs all processes in the container will be frozen. See details in cgroup freezer. If the process uses a timer to flush the buffered data, the timer won’t fire until the container thaws. The interval between the frozen and the thaw state is unpredictable, ranging from seconds to hours. Therefore, the data buffered in the OpenTelemetry SDK and Collector will have unpredictable latency.
The solution is to flush data out before the Lambda function returns, because it ensures that the Lambda container will not be frozen during an invocation. To achieve this solution:
- The SDK side needs to call force_flush() at the end of Lambda instrumentation.
- The Collector needs to remove all processors from config to keep one thread only from the receiver to the exporter. In this way, telemetry data is flushed to the backend synchronously at the end of every invocation. The side effect is slightly increased invocation time.
This is how it looks in the code:
 private static final BatchSpanProcessor SPAN_PROCESSOR = BatchSpanProcessor.builder(OtlpGrpcSpanExporter.builder().setEndpoint(OTEL_ENDPOINT).build()).build();

    public APIGatewayProxyResponseEvent handleRequest(APIGatewayProxyRequestEvent apiGatewayProxyRequestEvent, com.amazonaws.services.lambda.runtime.Context context) {
        // Start a span to trace the Lambda invocation
        Span span = tracer.spanBuilder("LambdaInvocation").startSpan();
        try {
            APIGatewayProxyResponseEvent apiGatewayProxyResponseEvent = new APIGatewayProxyResponseEvent();
            apiGatewayProxyResponseEvent.setBody("hello world");
            return apiGatewayProxyResponseEvent;
        } finally {
            span.end();// End the span
            SPAN_PROCESSOR.forceFlush().join(10, TimeUnit.SECONDS); //wait until spans are published, 10 sec max
        }
    }
After this change, we see the trace in our system:

Result:
Cold start: 3.8 sec
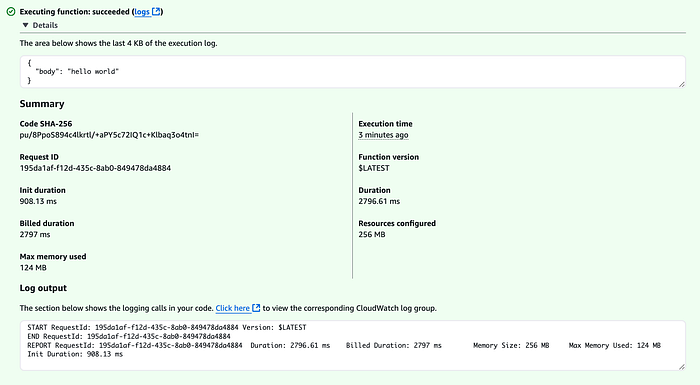
Warm state: 7–10ms
Approach 3: Lambda + OpenTelemetry Java SDK+SnapStart + Runtime hooks
Since we have a plain Java code we are free to use SnapStart feature. I already have a post about it and you can read about it here.
So to enable Snapstart we just need to add 2 params (“snap_start” and “publish=true”)to our Terraform resource:
resource "aws_lambda_function" "lambda-snapstart" {
  function_name    = "${var.function-name}-snapstart"
  source_code_hash = base64sha256(filebase64(local.lambda_payload_filename_snapstart))
  runtime          = "java21"
  handler          = "com.filichkin.lambda.SampleHandler::handleRequest"
  filename         = local.lambda_payload_filename_snapstart
  role             = aws_iam_role.lambda_role.arn
  memory_size      = 256
  timeout          = 20
  snap_start {
    apply_on = "PublishedVersions"
  }
  publish = true
}
Plus we need to make a priming in Java code using RuntimeHooks
Runtime hooks
These pre- and post-hooks give developers a way to react to the snapshotting process.
The Java managed runtime uses the open-source Coordinated Restore at Checkpoint (CRaC) project to provide hook support. The managed Java runtime contains a customized CRaC context implementation that calls your Lambda function’s runtime hooks before completing snapshot creation and after restoring the execution environment from a snapshot.
So let’s implement the CRaC Resource interface and add context registration to our constructor
public class SampleHandler implements RequestHandler<APIGatewayProxyRequestEvent, APIGatewayProxyResponseEvent>, Resource {
...
public SampleHandler() {
Core.getGlobalContext().register(this);
}
@Override
public void beforeCheckpoint(Context<? extends Resource> context) throws Exception {
Span span = tracer.spanBuilder("SnapStart").startSpan();
span.end();// End the span
SPAN_PROCESSOR.forceFlush().join(10, TimeUnit.SECONDS);
}
@Override
public void afterRestore(Context<? extends Resource> context) throws Exception {
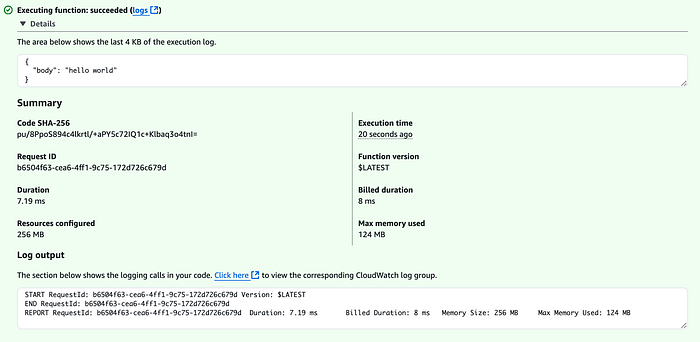
}Result
Cold start: 670ms
Warm state: 7ms


Let’s compare three solutions

Summary
- The Opentelemetry lambda layer works with zero code changes, but it is extremely slow
- Java has a stable Opentelemetry SDK but it produces an additional 3 seconds of latency for the simple lambda.
- SnapStart as expected solves the cold start problems and it’s the best solution for Opentelemetry and Java AWS Lambda.